How Do You Measure Customer Satisfaction in 2026
How do you measure customer satisfaction with CSAT, NPS, CES, churn, benchmarks and clear follow-up.

The most repeated advice about measuring customer satisfaction is to pick a single number and defend it. A close second is to run CSAT, NPS and CES side by side, call the result a dashboard, and consider the job finished. Both miss what a support lead needs, which is evidence that the help you gave changed what the customer did next.
A queue can post excellent satisfaction numbers while plenty of those same customers reopen the identical issue within days. The replies were courteous, the agents were quick, and nothing got fixed. An interaction score is a statement about a conversation. A conversation isn't a relationship, and a relationship isn't a renewal.
So measure at three distances. The moment tells you whether this contact went well. The journey tells you whether the problem stayed solved. Later behavior tells you whether the customer stayed, expanded, or left. For AI support, add a fourth reading that customers never see, covering whether the answer was correct and whether the task completed. Set that structure first, and the choice of metric becomes straightforward.
Satisfaction KPIs and What Each One Counts
Teams conflate three layers constantly. The interaction layer covers one contact. The relationship layer covers how the account feels about you overall. The outcome layer covers what the customer does with their money and their attention. Each survey metric sits in exactly one layer, and no metric in one layer predicts the other two on its own.
Here's the lookup table I'd pin above a support desk.
| Measure | Question it answers | Scale and formula | Blind spot |
|---|---|---|---|
| CSAT | Was this interaction satisfactory? | 1 to 5; percent of 4s and 5s | A polite reply can score high while the issue stays open |
| NPS | Would they recommend you? | 0 to 10; % promoters (9 to 10) minus % detractors (0 to 6); passives (7 to 8) excluded; −100 to +100 | Relationship intent, not the ticket that caused it |
| CES | How hard was this task? | 1 very easy to 7 very hard; report the mean, lower is better | An easy conversation can still be factually wrong |
| Churn | Did they leave? | Logo or revenue churn over a month or cohort | Many causes outside support; not a survey score |
| Behavioral signals | Did the help work? | Resolution, repeat contact in 7 days, escalation, refund, renewal | Needs a join to the survey or it stays an ops metric |
NPS is the one that ends up in board decks. It asks customers to rate, typically on a 0 to 10 scale, how likely they are to recommend the company, product or service. The Net Promoter Score framework published by Bain sorts responses into promoters at 9 and 10, passives at 7 and 8, and detractors at 0 to 6, then calculates the score as the percentage of promoters minus the percentage of detractors, with passives dropped from the arithmetic. The range runs from −100 to +100. If 55% of respondents are promoters and 20% are detractors, the NPS is +35.
That arithmetic makes NPS comparable across segments and quarters, and it makes the score nearly silent about the support ticket that triggered the survey. Bain's own guidance treats NPS as a relationship signal that works only when it's paired with post-conversation ratings, resolution status, escalation rates and qualitative feedback, so a rise or fall can be traced to specific experiences rather than admired in isolation.
Where each metric lies to you
CSAT inflates on courtesy. A warm, fast reply to an unsolved problem earns a 4. The customer leaves satisfied with the agent and frustrated with the product.
CES measures friction, not truth. A confident, easy answer that happens to be wrong produces a low-effort score and a second ticket three days later.
Churn has a dozen parents. Pricing changes, a competitor's launch, an internal reorg and a failed migration all move logo churn. Support contributes, but the score can't claim the credit or absorb the blame.
Behavioral data stays ambiguous until joined. Repeat contact within seven days is the cleanest early failure signal a support team owns, and it means nothing sitting in an ops dashboard disconnected from the survey response.
Practical rule: one primary survey metric per moment, always stored in the same row as resolution status and one later behavior. If a score can't be traced to a transcript and a follow-on event, it's decoration.
The pairing that holds up is unglamorous. Ask CSAT after a resolved conversation, ask CES after self-serve, run NPS quarterly as a relationship pulse, and treat churn and repeat contact as the verdicts. If effort is the signal you're adding first, the breakdown of how the customer effort score is calculated and reported covers the scale choices worth copying. No single row in that table proves loyalty, and a program built on one row is a program that can report good news while the accounts drain.
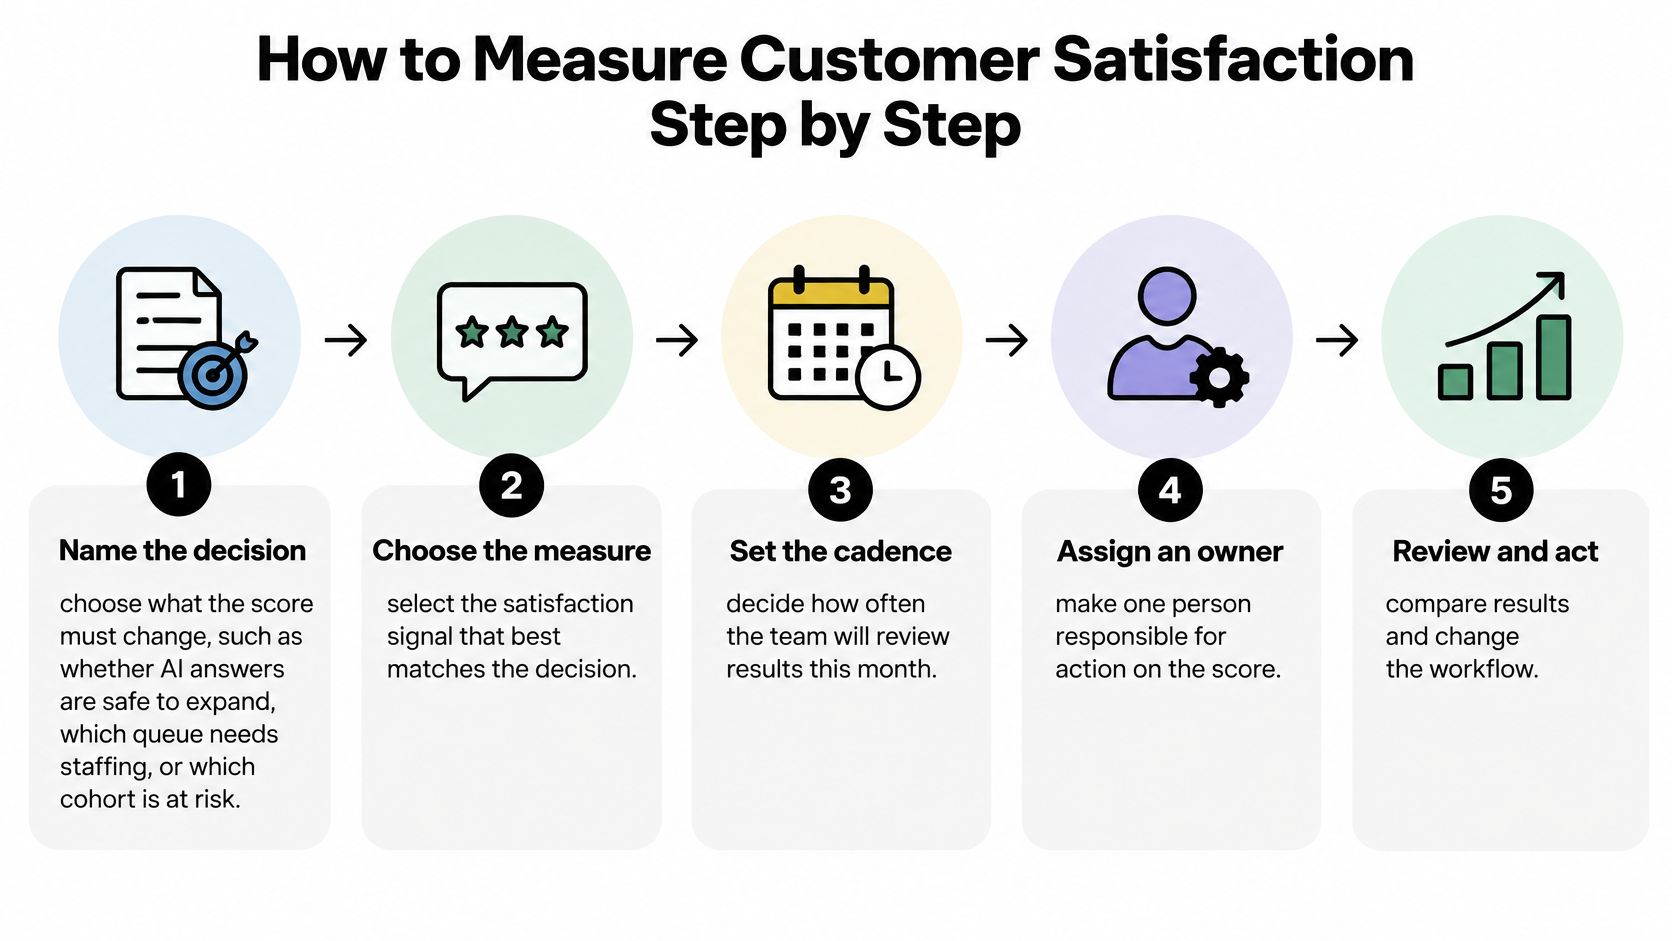
How to Measure Customer Satisfaction Step by Step
Most measurement programs fail before the first survey sends, because nobody agreed what decision the number was supposed to change. A score that can't alter a staffing call, a rollout decision or a retention play becomes a monthly ritual with a chart attached. The sequence below is the one I'd run inside a single month.
-
Name the decision the score must change. Whether AI answers are safe to expand to a new topic, which queue needs another body on Monday, which cohort is renewal risk in the next 90 days. Write the decision down. A metric with no attached decision gets ignored by the second month, and rightly so.
-
Pick one primary metric per moment. CSAT after a resolved support interaction, CES after a self-serve completion, NPS as a quarterly relationship pulse, and churn plus repeat contact as outcomes. Running three survey metrics on the same moment produces three averages nobody can act on.
-
Freeze the scale and the formula in writing. Define what counts as satisfied (4 and 5 on a 5-point scale), how the score is computed, and who owns it. Change the definition mid-year and you lose the trend line that made the metric worth collecting.
-
Attach context to every response. Channel, language, product area, resolved or unresolved, time to resolution, and whether a human took over from the bot. Without those fields a response is an opinion; with them it's a diagnostic.
-
Ask at a deliberate moment. After resolution or after a clear failure, never in the middle of an open wait. A survey that arrives while the customer is still stuck measures their patience with your survey, not your support.
-
Cap the asks and rotate the sample. Survey the same person after every contact and they'll learn to dismiss the widget. Set a recontact window and randomize who receives the ask so the respondent pool stays representative instead of collapsing to your most patient customers. Operators who run shared amenities for a fixed audience run into exactly this, and the thinking behind satisfaction surveys for break room users shows how quickly a captive audience tunes out repeated questionnaires.
-
Keep one open comment with the score. One optional text field outperforms a longer rating grid. It's where the pricing complaint and the missing article both show up in the customer's words.
-
Join each response to behavior 30 to 90 days later. Repeat contact, refund, upgrade, renewal or churn. This join is the difference between a satisfaction program and a satisfaction report.
-
Review operations weekly and loyalty monthly. One named owner holds the number and runs both meetings. Two owners produce two stories about the same data.
Say a SaaS team ships an AI chat widget for billing questions. They score each conversation on CSAT the same day, tag whether the customer marked it resolved, and then check seven days later whether those customers opened another ticket. Within a month, the pattern that matters shows up: the conversations that ended without an explicit resolution keep producing follow-up tickets, regardless of how politely they scored.
What to Ask and When to Ask It
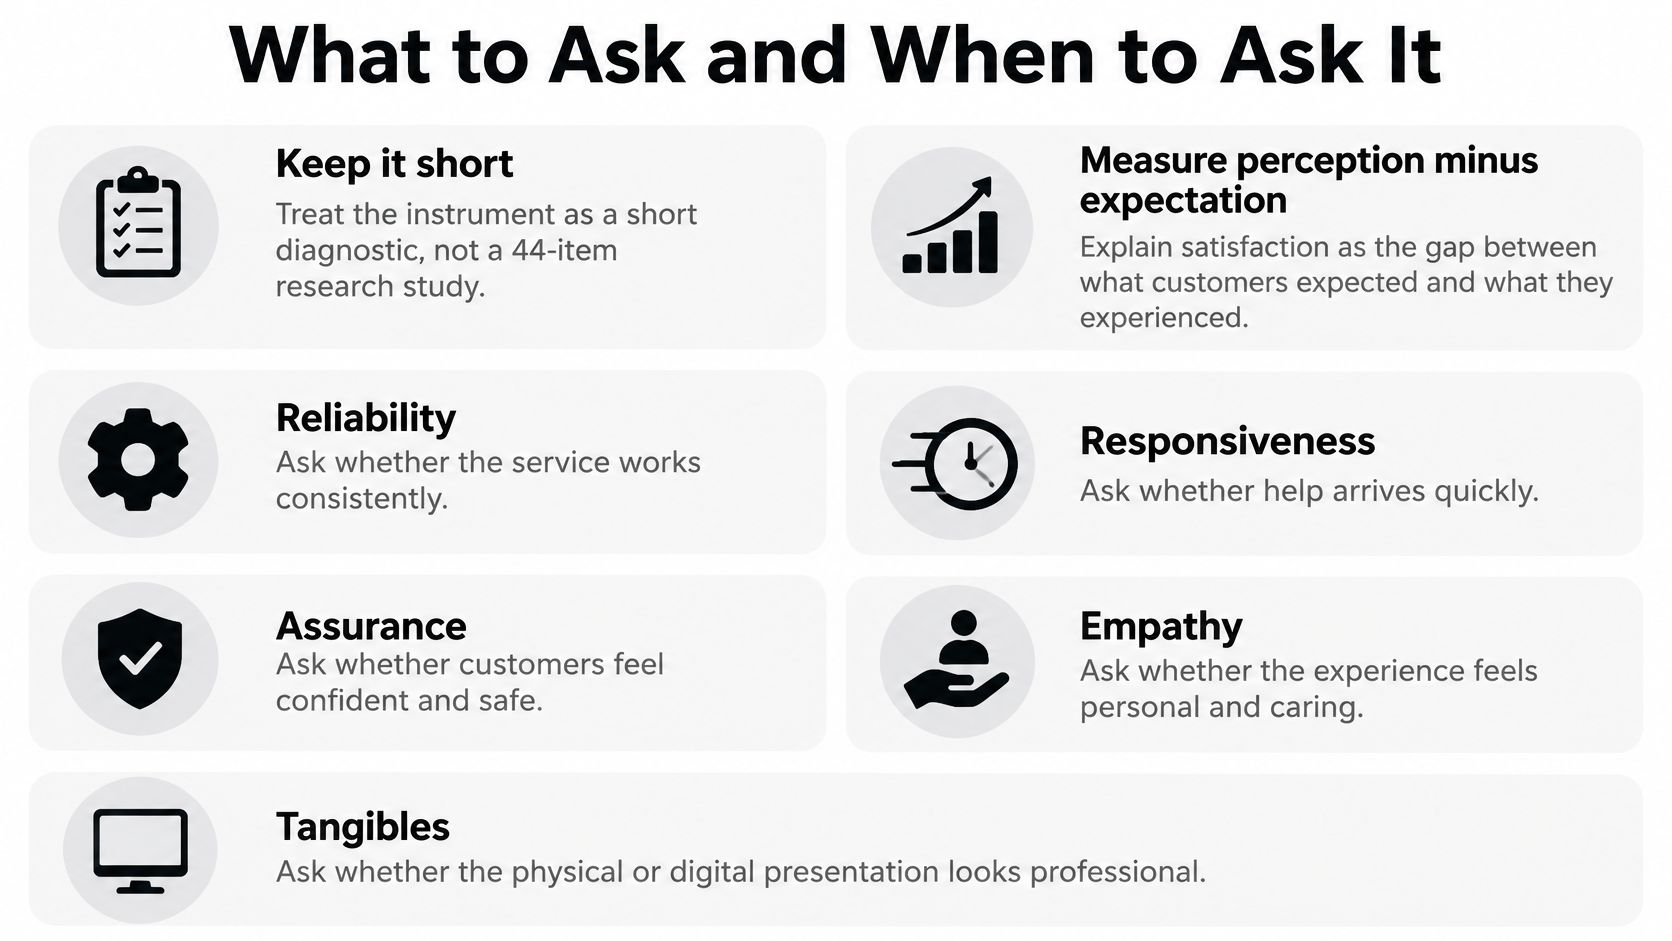
A 44-item instrument doesn't belong in a chat window. The logic underneath it does. SERVQUAL, developed by Parasuraman, Zeithaml and Berry in work published in 1985 and refined in 1988, measures satisfaction as the gap between expectation and perception. The original instrument carried 22 expectation items and 22 perception items, producing 44 scored responses per participant, and its first empirical basis included a mail survey of 300 customers of a regional telephone company, as documented in this review of service quality measurement.
The mechanic is simple. Subtract the expectation score from the perception score for each item. A positive gap means you exceeded what they expected; a negative gap names the unmet need. That logic survives the move to digital support, because a customer can receive a technically correct answer and still be dissatisfied if it arrived slowly, read badly, or left the task unfinished. It all comes down to how do you measure customer satisfaction at the level of the gap rather than the verdict.
Four questions after every chat
- Outcome satisfaction: how satisfied are you with the help you received, on the 1 to 5 scale.
- Effort: how easy was it to get what you needed, on the 1 to 7 scale, reported as a mean.
- Resolution: is your issue resolved, yes or no. This single binary field prevents more bad reporting than any rating question.
- One verbatim: what was missing, or what would have made this better. Optional, one line, free text.
Translate the five dimensions into a chat window
Tangibles become clarity: does the widget, the links and the step list look like something a person can follow. Reliability becomes factual correctness and kept promises. Responsiveness becomes time to first useful answer. Assurance becomes the customer's confidence that they can act on the reply. Empathy becomes tone and acknowledgment of what went wrong.
Those dimensions are why a guest-facing operation obsesses over presentation the same way a support team obsesses over wording. Anyone weighing smarter rental stocking with Avistar is solving the tangibles problem in physical form, where a property that doesn't match its listing photos creates the exact expectation gap that a broken help widget creates online.
Timing decides more of the response rate than wording does. Fire the ask at a terminal state, which means resolution or an explicit handoff to a human, within a few minutes on chat and within 24 hours on email. A survey embedded in the panel the customer already used gets answered; a separate emailed link gets ignored, and the guidance on building a website feedback widget that people finish covers the trigger and copy decisions that make the difference.
Cut every result by channel and language before anyone publishes a headline number, because a strong in-app score will happily hide a weak email score for a quarter.
The check the customer never sees
Add an internal correctness review that respondents don't rate: did the answer match your source material, and did the task complete. AI-generated responses can be inaccurate or unsuitable, and customers are responsible for testing agent behavior and reviewing important output before trusting automated replies on consequential topics. Keep that check separate from the customer-facing score so a friendly tone can't mask a wrong answer.
Target Bands and When a Score Lies
Bands are operating targets, not trophies. The numbers below are starting points I'd set on day one and then replace with your own baseline once 90 days of data exists. Your product, price point and customer mix will move them.
| Signal | Needs work | Acceptable | Strong |
|---|---|---|---|
| CSAT top-two-box (4 to 5) | Under 70% | 70% to 79% | 80% or higher |
| NPS | Below 0 | 0 to 30 | Above 30; above 70 is exceptional |
| CES mean (1 easy, 7 hard) | Above 5 | 3 to 5 | Under 3 |
| Monthly logo churn | Above 5% | 2% to 5% | Under 2% |
| Repeat contact within 7 days | Above 25% | 10% to 25% | Under 10% |
Read them as pairs, never as singles. A 3.1 CES mean with 82% CSAT looks healthy until you split by cohort and find that self-serve users under a certain plan tier are averaging above 5 on effort. The aggregate was reporting a blended reality that no individual customer experienced.
The cohort read that catches a lying score
Take a segment with rising CSAT and rising repeat contact in the same month. The interaction scores are grading courtesy, and the repeat contact is grading the actual outcome. Whichever number you present to leadership, the pairing is the finding.
The AI version of that failure wears different clothes: high containment, meaning the bot closed the conversation without a human, next to weak perceived help. Containment is an automation success metric. It says the bot ended the chat, not that the customer got an answer. The analysis of CSAT, NPS and CES and what each one predicts makes the same point sharply: CSAT measures satisfaction with a specific interaction, CES measures perceived effort and NPS measures advocacy, and none of the three reliably explains whether a customer will renew, repurchase or churn. A customer may rate a support interaction highly because the agent was courteous and still leave because the product is expensive, unreliable or hard to use.
Satisfaction is one signal in a causal system. It isn't proof that support created loyalty, and a leadership deck that treats it as proof will eventually be embarrassed by a churn chart.
Set the service level in writing
For a formal target, express each one as a share of responses over a rolling 90-day window. Something like: at least 80% top-two-box CSAT, and under 10% repeat contact within seven days. Roll the window so one bad week doesn't trigger a panic rewrite of the targets, and revisit the bands only after your own baseline exists. When a single team serves several segments, split the target rather than averaging them; mapping the customer journey before you set the threshold usually reveals that the flat target was hiding two very different experiences.
Diagnosing Whether the Survey Hears the Right Customers
A clean average can rest on a biased sample and look identical to a healthy one. Before you defend a number, test who produced it.

Test the sample before you trust the average
Start with response rate against send volume. If the rate falls as you send more surveys, the people still answering are the finishers, not the busy, the angry or the already departed. Compare respondents and non-respondents on plan tier, channel, and whether they contacted support again within seven days. That comparison measures the gap instead of guessing at it.
Rotate or randomize who receives the ask. Surveying every single conversation thins the pool through fatigue and turns your sample into whoever tolerates questionnaires. Then cut every result by channel and language before publishing one figure, because the blended number is the one most likely to be wrong.
The AI layer has its own distortion. Reporting summarized in this analysis of how satisfaction metrics are evolving found that 86% of companies believed customers were satisfied with AI-powered service, compared with only 51% of consumers who agreed. That gap is what you get when internal automation success gets reported as customer satisfaction.
Treat containment, deflection and agent productivity as separate measures from perceived helpfulness. Track factual correctness and task completion beside any containment rate, and never let a containment figure stand in for a satisfaction result in the same slide.
When a flat score is actually a warning
A stable score sitting on a shrinking response rate isn't stability. It's attrition with good PR. Pull verbatims and run driver analysis per segment, because one average masks a pricing complaint in one group and a slow answer in another, and the fix for each is different. Thematic tagging on the open-text field, covered in this walkthrough of how to analyze customer feedback by theme, turns a wall of comments into a ranked list of causes within an afternoon.
Add a behavioral check before the next leadership readout. If the score held but repeat contact rose, the score held for the wrong reason. Silence from churned customers is the most expensive nonresponse in the dataset, and no amount of survey redesign brings those answers back.
Turn Each Score into a Weekly Follow-Up
Measurement earns its keep in the follow-up, not in the chart. Put a weekly slot on the calendar, one hour, with the score export and the transcript view open side by side, and work it in this order.
Detractors and unresolved low-CSAT contacts get a human reply within one business day. Attach the verbatim so the reply addresses the actual miss rather than offering a generic apology. Speed matters less than specificity, and the guidance on how to connect with parents using Bornbir's messaging tips makes the case well: a warm, specific message to someone who was upset changes the relationship in a way a template never does.
Passives get a fix, not a thank-you. When their comments cluster around the same missing article or the same confusing step, ship the article or simplify the step. A polite acknowledgment with no change behind it teaches people to stop answering.
Promoters get asked for a story or a reference only after the issue is closed. Ask early and you burn the goodwill you were trying to bank.
Four labels for the comment backlog
Sort every open-text response into one of four buckets and keep the list short enough to clear: knowledge gap (the answer didn't exist in your sources), product bug (the answer existed and the product broke), policy friction (the rule itself is the problem), handoff failure (the transfer dropped the context). A backlog with more labels than that becomes a taxonomy project instead of a fix list.
Write the escalation rule in plain language so it survives staff turnover. Billing disputes, anything touching legal or account security, and low-confidence answers on complex queries leave the bot for a person. That's how we build it in SupportGPT, where escalation instructions are written in natural language and keyed to query complexity rather than to keyword lists, and the Conversations view keeps the transcript attached so a low score opens onto the exchange that produced it.
Two weeks after any change to a source, a macro or an escalation rule, check whether resolution and repeat contact moved. Not the average. The average will drift upward on its own as respondents get used to the widget.
The score you can't trace to a transcript and a customer-visible change is the score that will embarrass you in a renewal review.
This week's decision is narrow on purpose: pick one segment, give its score a named owner, and commit to one fix the customer will notice, then send the follow-up note that closes the loop. That note is worth building properly, and the templates for a clear issue resolved email are a reasonable place to start. Every program that measures customer satisfaction well ends up doing the same unglamorous thing weekly, which is turning a number into a reply and a reply into a repair.
If you want the transcript sitting next to the score without building the plumbing yourself, SupportGPT handles that loop: a widget that answers from your own sources, escalation rules you write in plain language, and analytics that keep feedback and sentiment attached to each conversation. You can add your knowledge, shape the tone, test real questions and deploy in minutes, then watch resolution, handoffs and satisfaction in one place. Visit SupportGPT to see how the measurement and the fix end up in the same dashboard.