Chatbot Performance Metrics That Actually Matter
Learn the chatbot performance metrics that drive real results, from containment and CSAT to latency and fallback rate, with formulas and benchmarks.
Most advice about chatbot performance metrics starts with a dashboard. That's backwards. A dashboard full of containment, response time, and CSAT can make a weak bot look healthy if it combines easy and difficult conversations into one average.
I've seen bots earn executive praise because they contained a large share of chats while giving unhelpful answers, forcing repeat contacts, or escalating only after frustrating the customer. The useful question isn't “What's our chatbot score?” It's “Which user intents does automation solve, for whom, at what cost, and with what risk?”
That distinction matters because chatbot adoption is no longer marginal. One industry summary reports that 80% of companies either use or plan to use AI-powered chatbots for customer service, while another reports that 91% of businesses with 50 or more employees use AI chatbots somewhere in the customer journey. The same source says 81% of consumers used a customer support chatbot in the previous 30 days, and that AI handles 30% of customer service cases, with a projection of 50% by 2027. See the full chatbot adoption and performance statistics.
At that scale, a small measurement error can distort staffing plans, product priorities, and customer experience decisions. The remedy is an intent-level system that reads engagement, resolution, quality, efficiency, and business impact together.
Why One Chatbot Score Is Never Enough
The default executive report is usually containment rate. A bot contains a conversation when it handles the interaction without human assistance, so the metric looks like a direct measure of automation success. It isn't.
Consider two intent groups that together produce the same overall containment rate of 62%. The first group covers password resets. The bot answers instantly, users complete the reset, and few customers return. The second covers billing disputes. The bot produces a generic policy answer, users abandon the chat, and the system records no human takeover. The blended dashboard still reports 62%, although one intent is working and the other is failing.
The opposite can happen too. A bot may take longer on a complex account question because it retrieves the right policy, asks for authentication, and hands off with a complete summary. Its containment rate may be lower, but its resolution quality and escalation appropriateness can be much better.
Practical rule: Never approve a chatbot change based on an aggregate containment movement alone.
The core measurement unit should be the intent-channel-journey segment. “Order status” on a logged-in app is not the same workflow as “Where is my order?” from an anonymous website visitor. A pre-purchase product question has a different commercial outcome from a post-purchase delivery complaint. A support team that wants to understand these differences can use customer interaction analytics as a useful reference point for segmenting conversations and outcomes.
Track each segment across several dimensions:
- Intent: Billing, authentication, delivery, cancellation, product advice, or another defined user goal.
- Channel: Website chat, in-app messaging, social messaging, or voice.
- Journey stage: Discovery, purchase, onboarding, active use, renewal, or recovery.
- User cohort: New versus returning users, plan type, region, and authenticated status.
- Outcome: Completed task, repeat contact, escalation, abandonment, conversion, or negative feedback.
The executive view can still show a compact summary. But every top-line number must open into the segments that created it. Otherwise, your team is optimizing the average while customers experience the exceptions.
The Three Layers of Chatbot Performance Metrics
A reliable measurement system has three layers. Engagement tells you whether users start and continue conversations. Resolution tells you whether the bot handles the request. Business impact tells you whether that handling changes workload, satisfaction, revenue, or retention.
The layers form a chain. Weak engagement limits the number of conversations available for resolution. Weak resolution creates escalations and repeat contacts. Weak business impact proves that activity isn't the same as value.
Engagement comes first
Useful engagement measures include session starts, messages per session, bounce rate, conversation length, and response latency. A simple engagement rate can be expressed as:
Engagement rate = sessions with meaningful interaction ÷ chatbot sessions × 100
For a hypothetical weekly volume of 10,000 sessions, if 7,000 include a meaningful user action, the engagement rate is 70%. That example is arithmetic, not a benchmark. The point is to define “meaningful interaction” before reporting the result. A greeting followed by an immediate exit shouldn't count as healthy engagement.
Resolution measures the user's progress
Containment, fallback, escalation, goal completion, and first-contact resolution belong here. A basic containment formula is:
Containment rate = conversations resolved by bot ÷ total conversations × 100
If the same 10,000 sessions produce 6,200 conversations that end without human assistance, containment is 62%. That number says nothing about whether users achieved their goals, which is why it must sit beside fallback, repeat contact, and satisfaction data.
Business impact earns the investment
Business-impact metrics connect bot behavior to the operation. Examples include CSAT by intent, ticket deflection relative to a baseline, cost per automated conversation, assisted conversion, and workload reduction.
A simple automated resolution cost formula is:
Cost per automated resolution = bot operating cost ÷ verified automated resolutions
Using the hypothetical 10,000 sessions, suppose only conversations with a confirmed completed goal count as verified resolutions. The resulting cost should be compared with the human-agent cost for the same intent, not with a generic support average.
| Layer | Example metrics | Sample formula | What it answers |
|---|---|---|---|
| Engagement | Sessions, interaction rate, bounce rate, latency | Meaningful sessions ÷ total sessions | Are users starting and continuing? |
| Resolution | Containment, fallback, escalation, goal completion | Bot-resolved conversations ÷ total conversations | Is the bot handling the request correctly? |
| Business impact | CSAT, cost per resolution, conversion, ticket value | Bot cost ÷ verified resolutions | Does automation improve the operation or customer journey? |
Guidance on chatbot metrics and KPI layers describes the same movement away from traffic counts toward outcome-based measurement. Use the hierarchy to diagnose movement. A resolution decline with stable engagement points to intent handling. A business-impact decline with stable resolution points to poor outcomes, expensive workflows, or misleading success definitions.
Containment, Deflection, Fallback, and Resolution Compared
These four metrics answer different questions, yet teams often place them beside one another as if they were interchangeable. That creates bad decisions.
Containment measures whether the bot handled a conversation without a human. Deflection measures whether support demand was avoided relative to a baseline. Fallback measures failure to match or confidently handle an intent. Resolution measures whether the user achieved the intended goal.
Use the formula that matches the decision
Containment is useful for estimating handoff pressure. Its formula is:
Containment rate = bot-resolved conversations ÷ total conversations × 100
If 620 of 1,000 conversations end without a human, containment is 62%. It lies when abandonment, silent fallback, or premature session closure gets counted as resolution.
Deflection is operational rather than conversational:
Deflection rate = avoided tickets relative to baseline ÷ baseline support demand × 100
If a comparable baseline contains 1,000 support requests and the bot-assisted process produces 800, the apparent avoided demand is 200 requests, or 20% of the baseline. That result is only credible if the comparison period, traffic mix, and issue mix are comparable. Routing customers to email or a slower queue isn't genuine deflection.
Fallback rate exposes recognition and coverage problems:
Fallback rate = fallback events ÷ user requests or conversations × 100
If 80 of 1,000 requests trigger an unhelpful fallback, the rate is 8%. Repeated fallbacks in one conversation should be counted consistently, because an event rate and a conversation rate tell different stories.
Resolution rate must use a verified goal signal:
Resolution rate = conversations with confirmed goal completion ÷ eligible conversations × 100
A confirmation from a successful account action, completed order change, or post-chat outcome is stronger evidence than session closure.
| Metric | Definition | Formula | Where it lies |
|---|---|---|---|
| Containment | Conversation ended without human help | Bot-resolved ÷ total conversations | Abandonment and silent fallbacks can look successful |
| Deflection | Support demand avoided against a baseline | Avoided tickets ÷ baseline demand | Channel switching can appear to reduce demand |
| Fallback | Bot failed to match or confidently handle a request | Fallback events ÷ requests or conversations | One user can generate several events |
| Resolution | User achieved the intended goal | Confirmed completions ÷ eligible conversations | Weak goal instrumentation makes the denominator unreliable |
A high containment rate is trustworthy only when fallback remains controlled, users don't reopen the issue, and satisfaction holds by intent. Deflection deserves trust when ticket volume falls without repeat contacts or worsening outcomes. Fallback is a diagnostic signal, not a success score. Resolution should be the final authority for task-based support.
For a deeper treatment of whether customers solve issues during the first interaction, see this guide to first-contact resolution.
Quality, Efficiency, and Effectiveness as a Tradeoff System
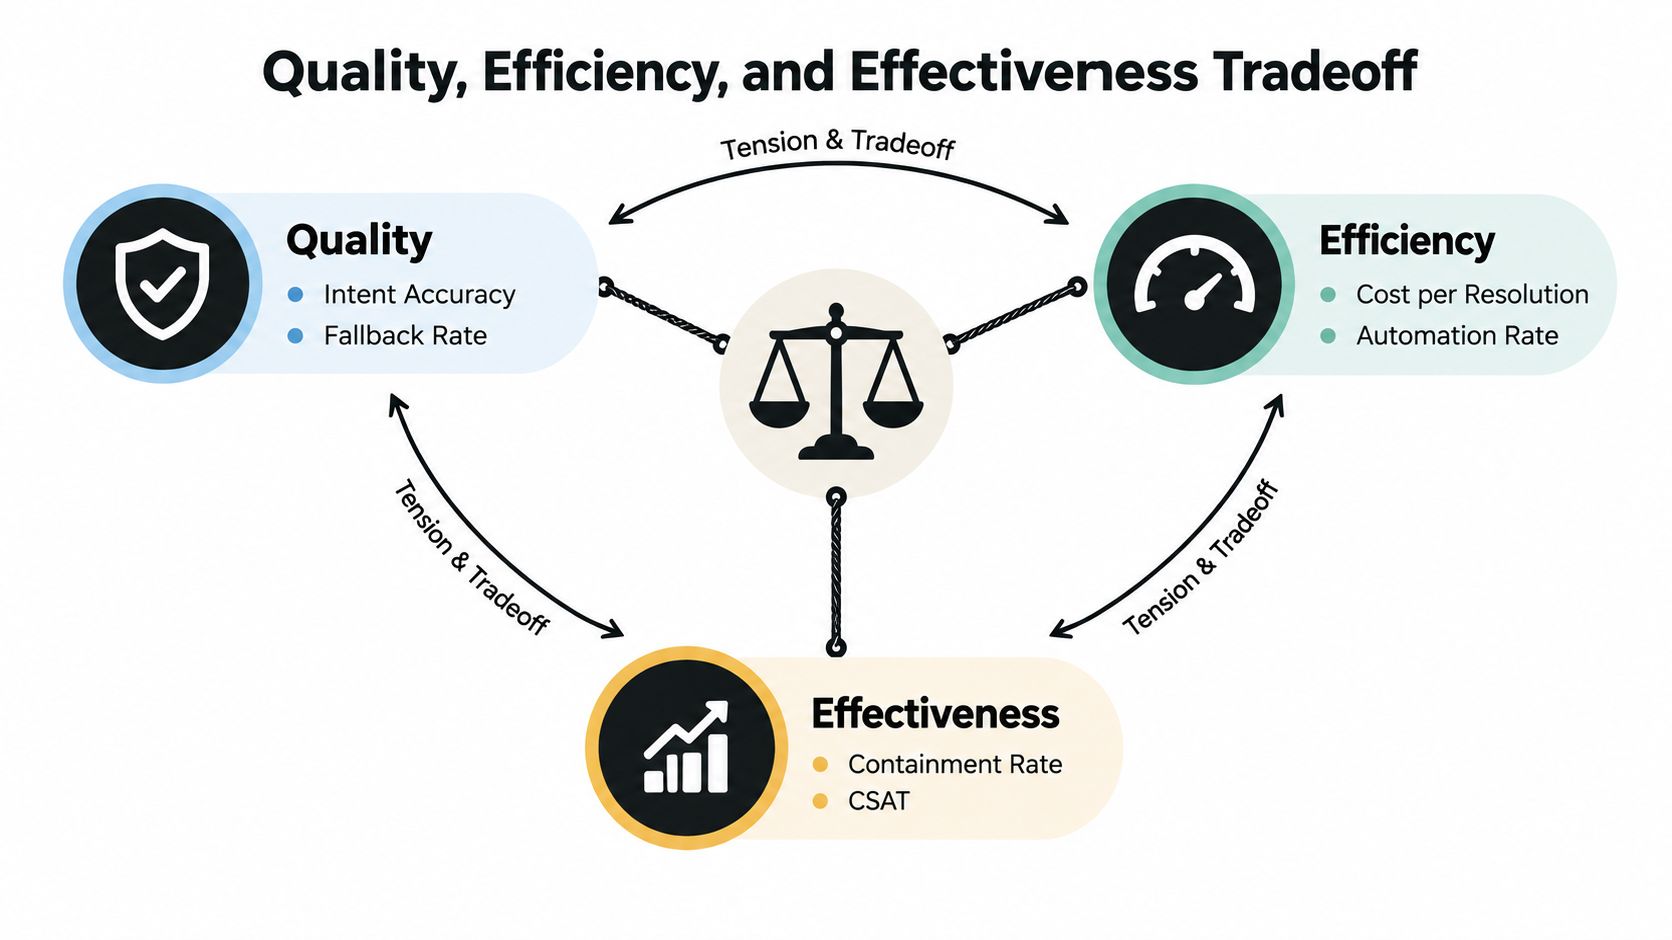
A fast answer isn't automatically a good answer. A cheap conversation isn't automatically an effective one. Chatbot performance should be evaluated across quality, efficiency, and effectiveness, because optimizing one axis can damage another.
Quality protects trust
Quality includes intent accuracy, answer relevance, factuality, groundedness, safety, and appropriate escalation. For a retrieval-based bot, groundedness can be represented as:
Grounded response rate = responses supported by approved sources ÷ evaluated responses × 100
The exact evaluation method depends on the use case. Human review, labelled test cases, and automated checks can work together, but the team must define what counts as supported before tracking the rate.
Quality fails when the bot answers confidently outside its knowledge, cites the wrong policy, or refuses to escalate a high-stakes request. A low fallback rate can hide this failure if the system treats every generated answer as a successful match.
Efficiency controls operating cost
Efficiency covers response latency, tool calls, conversation steps, token usage, and cost per session. Teams often focus on average latency, but tail latency matters when a subset of users waits for retrieval, authentication, or an external action.
Cost per conversation = model, retrieval, tool, and platform cost ÷ conversations
Lowering retrieval depth or using a smaller model may reduce latency and cost. It can also remove the evidence needed for a correct answer.
Effectiveness proves the task worked
Effectiveness is the outcome layer: goal completion, first-contact resolution, appropriate escalation, and downstream CSAT. A bot that gives a polished answer but leaves the customer unable to change a subscription has poor effectiveness, even if quality reviewers like its tone.
The right guardrails are explicit:
- Quality floor: Block releases if groundedness, factuality, or safety falls below the approved threshold.
- Efficiency ceiling: Investigate latency and cost increases by intent instead of accepting a global average.
- Effectiveness check: Require a verified user outcome, not merely a closed session.
- Tradeoff review: Compare speed, correctness, escalation, and satisfaction for the same intent.
The practical tension is simple. Skipping retrieval can make a bot faster while increasing unsupported answers. Expanding retrieval can improve grounding while increasing latency and cost. Track those movements in one intent-level view, then choose the tradeoff deliberately.
Instrumenting Events, Logs, and Dashboards That Hold Up
Metrics become unreliable when the event model is vague. Decide what the system records before launch, because retrofitting definitions after deployment usually produces incompatible history and missing fields.
Create an event taxonomy
At minimum, define these events:
- Session start and end: Record when the conversation begins and why it ends.
- Intent classified: Store the selected intent, confidence score, and candidate alternatives.
- Tool or retrieval call: Capture the tool name, source identifiers, success state, and retry status.
- Response generated: Store model version, grounding flags, safety result, and response timing.
- Escalation triggered: Record the reason code, destination, and whether the handoff succeeded.
- User feedback: Attach rating, comment, and feedback type to a stable session identifier.
Every event should include a timestamp, channel, locale, user cohort, and anonymized session token. Keep the raw transcript separate from analytics fields when possible.
Structured logs should flow into a warehouse, not stay only in application logs. A warehouse lets analysts calculate funnels, compare cohorts, inspect intent drift, and join chatbot outcomes with ticket or order data. The conversation analytics software guide is useful background for thinking about the operational views teams need.
Build the dashboard around decisions
Use an engagement row for starts, interaction, bounce, and latency. Use a resolution row for containment, fallback, escalation, and verified completion. Add a quality row for groundedness, accuracy review, correction rate, and CSAT. Every card should support a drill-down by intent, channel, journey stage, and user cohort.
Before trusting the dashboard, run this checklist:
- Validate client events: Confirm the SDK emits one consistent session start and end.
- Validate server events: Reconcile client-side actions with server-side tool and response logs.
- Define retries: Prevent repeated tool calls from inflating conversations or fallback counts.
- Scrub PII at ingest: Remove emails, account numbers, payment details, and other unnecessary identifiers before storage.
- Version definitions: Preserve the formula and event version behind every reported metric.
- Test joins: Verify that chatbot sessions connect correctly to tickets, orders, and customer feedback.
If an analyst can't explain the denominator, event source, and exclusion rules for a metric, that metric isn't ready for executive use.
Benchmarks and Segmented Targets by Use Case
Universal benchmarks are convenient and mostly wrong. A password reset, a product recommendation, and a billing dispute have different difficulty, risk, and user expectations. Setting one target across all three rewards the bot for taking the easiest work.
Use published guidance as a starting point, not a promise. One monitoring guide defines containment as “conversations resolved by bot / total conversations” × 100 and describes a good-performance band of roughly 50% to 65%, with fallback rates below roughly 8% to 15% for strong systems. Read that range alongside CSAT and verified resolution, as recommended in this chatbot performance monitoring guide.
Segment before setting targets
Segment by intent family, channel, user cohort, and journey stage. A logged-in in-app user may tolerate a more direct workflow than an anonymous visitor. A pre-purchase question can be judged partly by assisted conversion, while a post-purchase question should emphasize accurate resolution and repeat-contact reduction.
The table below uses qualitative target labels rather than invented universal thresholds. Replace each label with a value from your own baseline and human-agent comparison.
| Use Case | Containment Target | CSAT Target | Median Latency | Fallback Rate Ceiling |
|---|---|---|---|---|
| Password reset | High, when authentication is available | At least human baseline | Fast enough for a short transactional flow | Low and declining |
| Order status | High, with live order integration | At least human baseline | Fast after account lookup | Low for recognized order queries |
| Product advice | Moderate, with source-backed recommendations | Stable across product categories | Responsive, with retrieval budget monitored | Controlled by product family |
| Billing dispute | Conservative, with early escalation | Equal to or better than human baseline | Secondary to correctness | Strict, with reason-coded handoffs |
| Complex technical issue | Lower, with complete escalation summaries | Measured after resolution | Acceptable if diagnostics are running | Monitored by symptom and product version |
The target should compare the bot with the human-agent baseline for the same intent. If the bot matches human first-contact resolution and improves handling efficiency, a higher containment goal may be justified. If it increases repeat contacts, containment should be reduced even when the dashboard looks strong.
Update the intent target table on a regular operating cadence, and connect missed targets to retraining, content revision, integration work, or routing changes. Performance benchmarking for support teams can help structure that comparison. For teams evaluating multimodal assistants, multimodal sets for content detection provide useful context for designing test coverage across different input types.
Data Quality, Privacy, and Compliance Pitfalls
Bad instrumentation is a bigger threat than a bad dashboard design. A clean chart built from contaminated events gives leaders false confidence and sends engineers after the wrong fix.
Silent failures corrupt the numerator
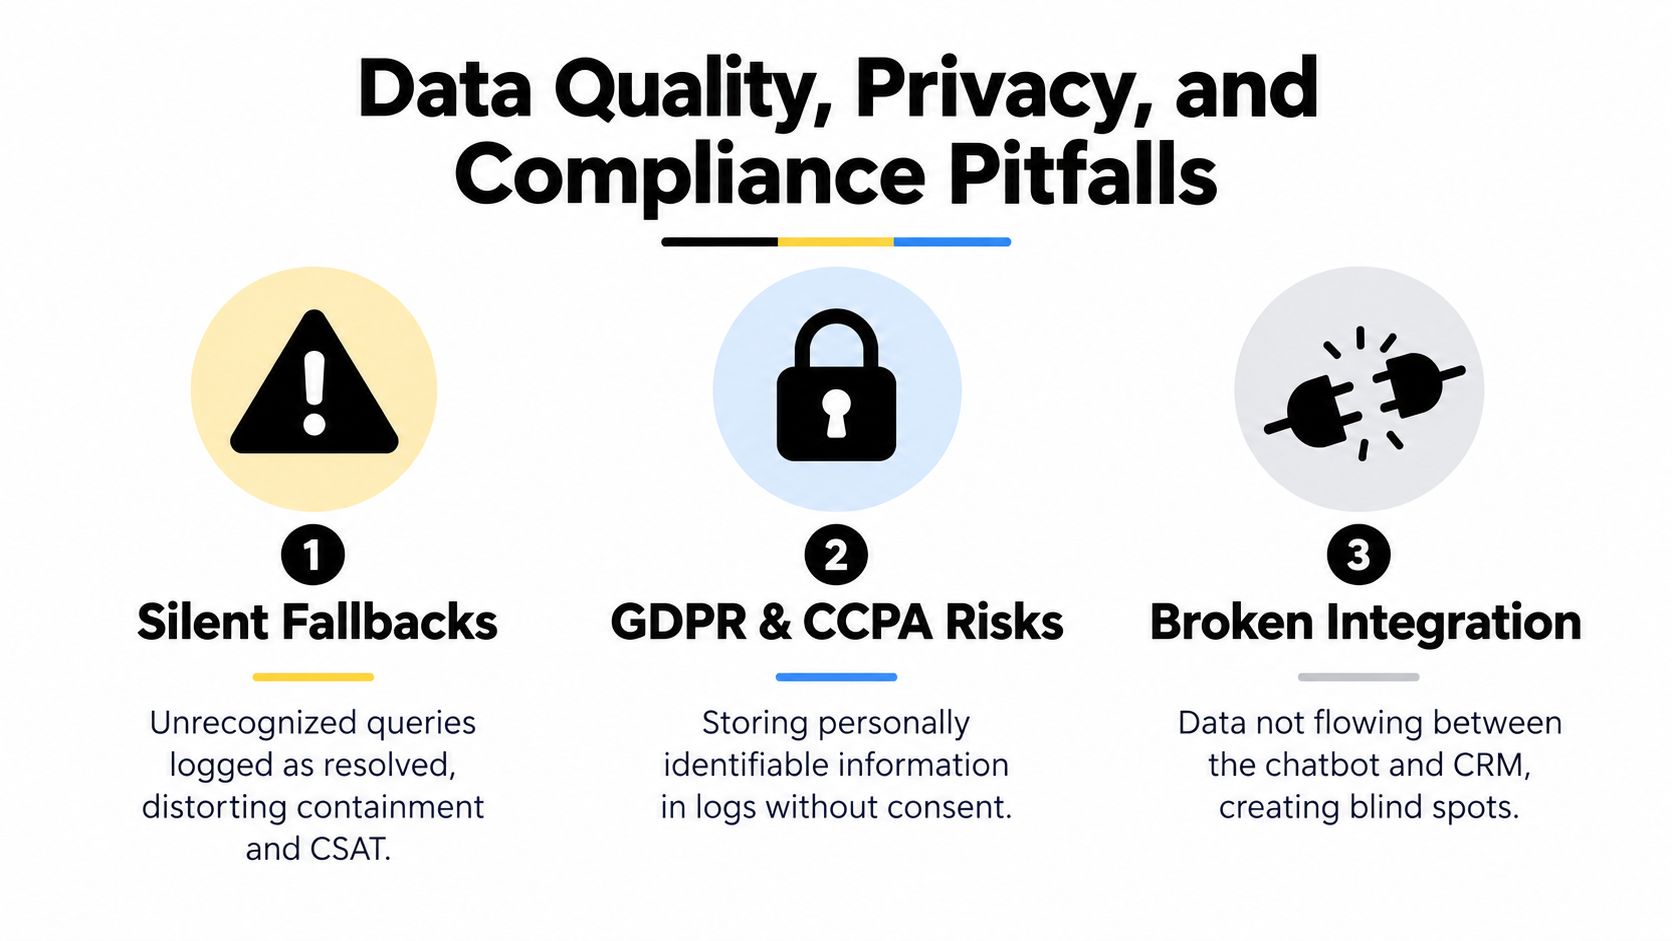
A silent fallback occurs when the bot doesn't understand a request but returns a generic answer without recording a failure. If the user leaves, the system may count the session as contained. The result inflates containment and makes CSAT appear healthier than the actual experience.
Survey sampling creates another distortion. If the survey appears only after a human handoff, the dashboard overrepresents difficult or failed conversations. If it appears only after a completed flow, it misses users who abandon before the prompt. Sample eligibility, timing, and response bias must be visible beside the score.
Intent misclassification causes cascading errors. The bot may answer from the wrong source, attribute the interaction to the wrong funnel, and send the wrong failure to the retraining queue. Automated tests and bot-generated traffic can inflate volume unless the analytics pipeline excludes them reliably.
Privacy controls belong in the pipeline
Transcripts, event payloads, and training exports can expose personal information. Redact unnecessary content before storage, separate PII fields from analytical dimensions, restrict access by role, and define retention windows. Hash user identifiers for analytics when identity isn't needed, but don't assume hashing makes sensitive content safe if the surrounding transcript remains identifiable.
Regulatory requirements depend on the workflow and jurisdiction. GDPR can create right-to-erasure obligations for chat logs. CCPA can require opt-out signals. Health-related bots may cross HIPAA boundaries, and payment flows can affect PCI scope. Your legal and security teams should review the actual data path, not just the vendor label.
Use this audit checklist before trusting a metric:
- Sanitize at ingest: Remove unnecessary personal and payment data before warehouse insertion.
- Separate identities: Keep user identity fields apart from performance events.
- Verify sampling: Check who receives surveys and who is excluded.
- Exclude automation: Filter test, monitoring, and bot-versus-bot traffic.
- Audit integrations: Confirm CRM, ticketing, and order events arrive with stable identifiers.
- Document deletion: Test deletion and retention processes for stored conversations.
For a practical framework around storage duration and deletion decisions, review these data retention policies for support analytics.
Turning Metrics Into Improvements and a 30-Day Loop
A blended chatbot score is a poor operating target. Improvements happen at the intent level, where teams can connect a specific failure to a specific intervention. Falling CSAT on billing intents calls for a content and escalation audit. Rising fallback on order-status questions points to a missing authentication step or a broken order lookup. Latency spikes after retrieval changes require engineers to inspect chunking, ranking, and tool-call traces.
Run five steps without skipping the feedback loop
- Instrument: Capture events, outcome signals, and segment fields for each interaction.
- Baseline: Record containment, fallback, verified resolution, CSAT, latency, and escalation by intent and channel.
- Hypothesize: Select the likeliest cause, such as missing content, weak classification, unavailable authentication, or excessive retrieval.
- Ship: Change one meaningful part of the flow, source set, prompt, routing rule, or integration.
- Re-measure: Compare the same segment with its baseline, including negative outcomes and repeat contacts.
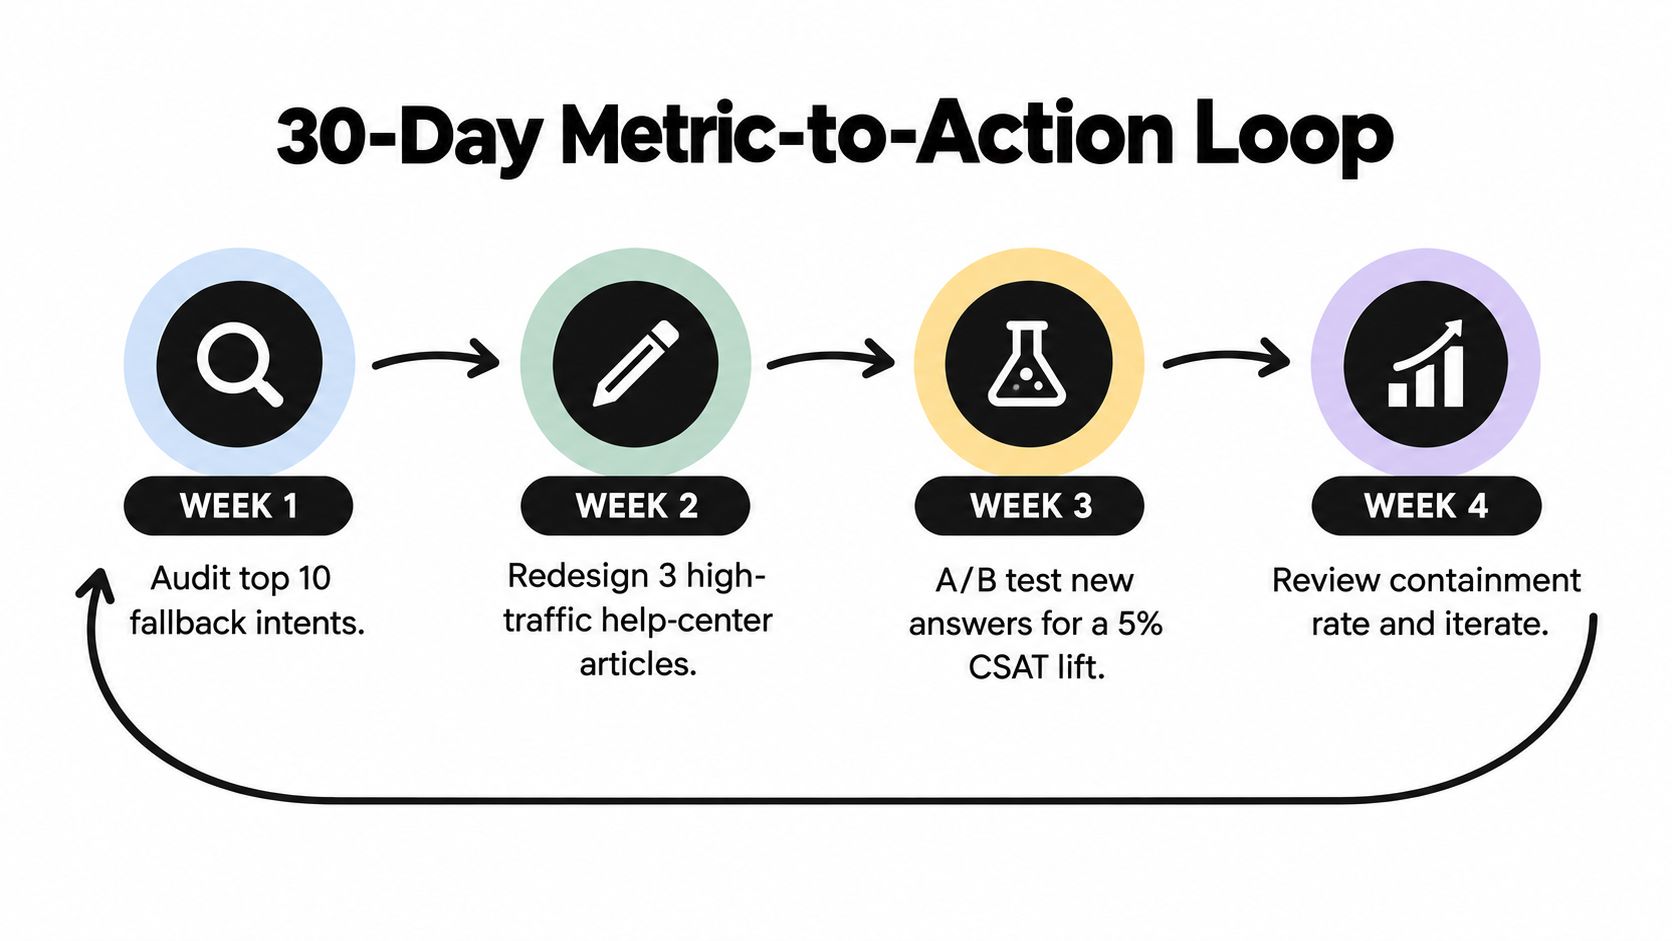
Use a practical 30-day schedule:
Week 1: Establish intent-level baselines and identify the three largest problem intents. Review transcripts and traces, not dashboard cards alone.
Week 2: Ship narrow fixes. Rewrite unclear prompts, add missing answer sources, repair authentication paths, and make escalation reasons explicit.
Week 3: Add regression tests for changed intents and tighten sampling. Confirm that gains do not reduce grounding, raise latency, or push users into an inferior channel.
Week 4: Compare results with the baseline and write a short retrospective. Record the change, the metric movement, the benefiting segment, and unresolved problems.
Hold a weekly 20-minute review with support, engineering, content, and analytics. Ask which intent deteriorated, what intervention shipped, and what evidence will confirm the fix. Give executives a monthly view linking chatbot movement to ticket volume, verified resolution, and cost per resolution.
SupportGPT offers configurable AI support agents, source-based training, escalation rules, conversation tracking, and analytics for chats, topics, sentiment, channels, feedback, and workspace usage. Its platform can support intent-level measurement while teams manage support conversations in one place. Visit SupportGPT.
Audit your top intents this week, define a verified resolution event, and replace the single blended containment number with a segmented dashboard. Then use those outcomes to guide deployment, monitoring, and improvement of AI support agents.